
R. J. Huang*, L. Yang, J. C. Shen, W. Yuan, Y. Q. Gong, H. Y. Ni, J. Duan, J. Yan, H. B. Huang, Q. H. You, and Y. J. Li (2021), Chromophoric Fingerprinting of Brown Carbon from Residential Biomass Burning, Environmental Science & Technology Letters, 9(2), 102-111, doi:10.1021/acs.estlett.1c00837.
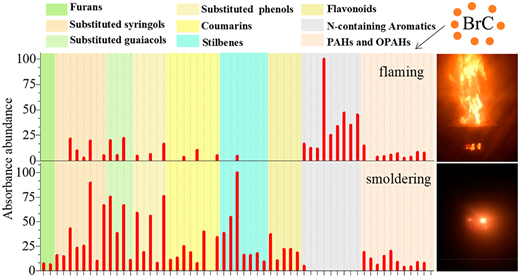
Emissions from residential biomass burning are a significant source of atmospheric brown carbon (BrC). In this study, we used liquid chromatography-photodiode array-high resolution tandem mass spectrometry to investigate the chromophoric fingerprinting of BrC emitted from residential biomass burning. In total, 59 major chromophores were identified, which accounted for 49–85% of the total light absorption of BrC (averaged between 300 and 500 nm) for different samples. These chromophores include furans, lignin pyrolysis products, coumarins, flavonoids, stilbenes, N-containing aromatic compounds, and unsubstituted or oxygenated polycyclic aromatic hydrocarbons, of which some are newly reported as BrC species (e.g., stilbenes and substituted phenyl cyanates). Among the chromophores identified, seven are common to all samples while some are specific to certain biofuel or burning conditions. For instance, 3,3′-dimethoxyquercetin from wheat burning, p-hydroxybenzaldehyde and apigenin from maize smoldering, 4-nitro-2-vinylphenol from maize flaming, and nodakenetin and anthanthrene from wood flaming are specific to the fuel type or burning condition. The identified optical markers will be essential for understanding atmospheric chemical and optical processes of biomass burning BrC in future studies, while the source-specific chromophore profiles developed in this study are a prerequisite for apportioning the biofuel types and burning conditions, which is a key for estimating source-specific radiative forcing.